Aviation Safety Monitor Weekly Report for the Week Ending April 6, 2024
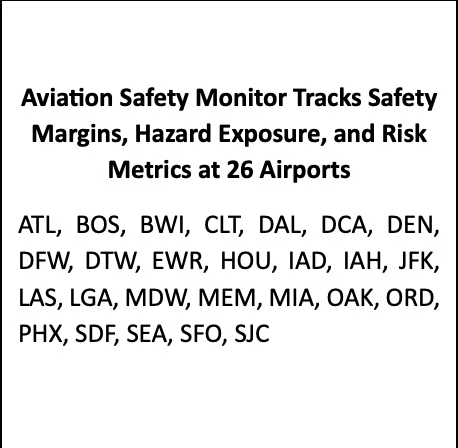
This is the first posting of the Aviation Safety Monitor Weekly Report. Each week, Robust Analytics will report on safety margins at 26 United States airports. Our safety monitoring capability builds on several years of aviation safety research by Robust Analytics that was partially funded by the NASA System Wide Safety Project and Small Business Innovation Research program. With this Aviation Safety Monitor Weekly Report, Robust Analytics offers the aviation community timely assessments of changing safety margins and safety-related events. Ideally, tracking changes in terminal airspace safety margins will help to detect unsatisfactory trends in aviation safety, as illustrated by the clustering of safety-related events in late 2022 and early 2023. That series of close calls generated the FAA Administrator’s call for an unprecedented Safety Summit, followed by the establishment of the National Airspace System Safety Review Team.

This week we introduce the approach and metrics we will use to estimate safety margins in terminal airspace. Links to articles on the Robust Analytics website provide more information on the technical approach and methods. The first three weekly reports will focus on recent trends in safety margins for the 26 monitored airports and explain how we estimate safety margins. Future installments will present data for individual airports and examine how safety margins changed over the past couple of years. Please read our article “Did Safety Degrade in the National Airspace System in the Winter of 2022-2023?” that applies our methods and data to examine whether safety margins decreased during the events of winter 2022-2023.
The Aviation Safety Monitor measures safety margins by estimating the frequency, duration, and severity of buffer encroachments. A buffer encroachment occurs when an aircraft pair is predicted to be closer than the minimum separation standard – both lateral and vertical – for that airspace. The encroachment algorithms account for aircraft type (heavy and other aircraft), airspace rules, horizontal distance between successive aircraft, and vertical separation. FAA has defined minimum separation standards when aircraft are under Instrument Flight Rules (IFR). In this research, the buffer encroachments use the separation standards as a baseline to define the adequate safety margin levels.
The buffer encroachment algorithms do not identify loss of separation events. Instead, they evaluate what would occur if aircraft continued on their current speed and heading. Avoidance of a loss of separation when a buffer encroachment occurs requires action by flight crews and controllers. In many cases, these actions call for the aircraft to follow well-defined procedures accurately and in a timely fashion. In that sense, when the algorithm identifies a buffer encroachment it highlights a situation in which pilots and controllers must operate with a shared awareness of what all aircraft in the airspace will be doing. It is with this understanding that we interpret buffer encroachments as a measure of safety margins in the airspace. Details on how we calculate safety margins are found in this document. (For more information on methods, please read “How Do We Measure Safety Margins?” posted on the Robust Analytics homepage.)
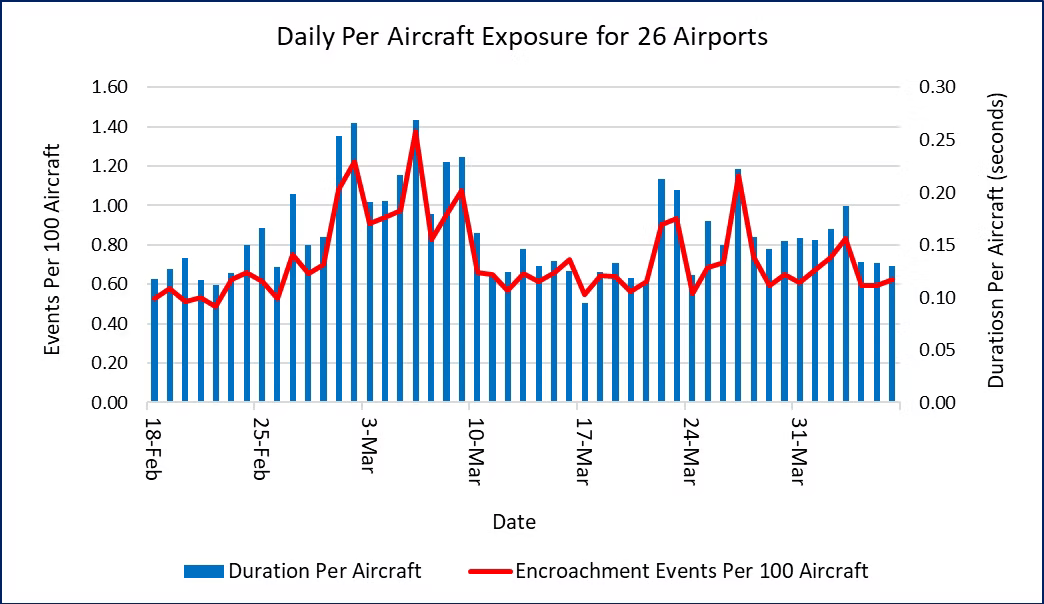
We estimate duration and severity for every buffer encroachment. Figure 1 shows the total daily counts of the number of encroachments and their durations across the 26 airports in the 17 metropolitan areas that we monitor. The blue bars are total daily encroachment durations summed over all 17 terminal airspaces. The red line reports the daily number of encroachment events.

Figure 1. Daily Encroachment Counts and Durations for 26 Airports
(February 18, 2024 through April 6, 2024)
The time series exhibits significant variation over the past seven weeks, with the peak day more than twice as high as the lowest day. We observe two extended periods with elevated encroachments: from February 27 to March 13, and a slightly lower peak period from March 22 to April 3. Buffer encroachment counts and durations follow a similar pattern.
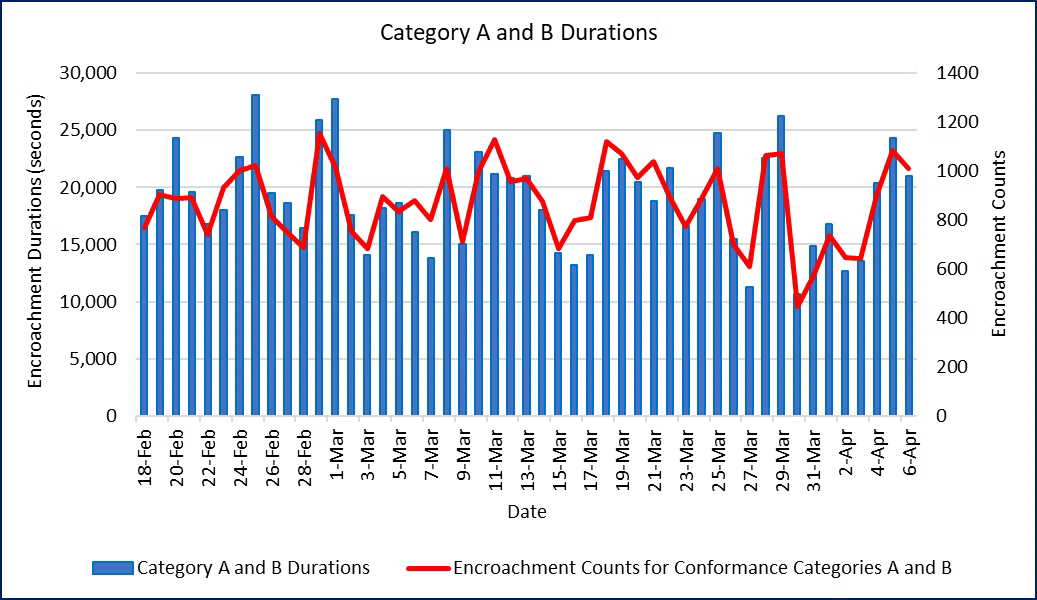
How severe are these encroachments? The FAA defines three separation conformance categories based on how far they are from the separation index. (See the description “How Do We Measure Safety Margins?” for details on the conformance categories and how we measure them.) In that classification system, Conformance Categories A and B are the most severe. Under our definition of a buffer encroachment, Category A and B encroachments are counted under all meteorological conditions.
The daily durations and event counts for the sum of Category A and B encroachments are shown in Figure 2. The pattern differs from the first two charts, as there is no obvious trend during the time period. This suggests that Category PE and C encroachments are affected by different factors from Category A and B. We will take a deep dive into those differences in a future weekly report.

Figure 2. Encroachment Durations and Event Counts for Conformance Categories A and B
Each week we will update Figures 1 and with the most recent seven days of data. We will also examine topics of interest and take a deeper dive into the safety metrics. Please send us your suggestions and questions, we will do our best to respond.
How Do We Measure Safety Margins?
The Aviation Safety Monitor summarizes output from Risk Tracker, the Robust Analytics in-time terminal airspace hazard and safety metrics monitoring system.

About the Aviation Safety Monitor
The Aviation Safety Monitor is a service provided by Robust Analytics to deliver timely information on terminal area safety in the National Airspace System (NAS). The safety monitoring and prediction technologies were developed by Robust Analytics over the past several years. Partial funding was provided by the NASA Small Business Innovation Research Program and the NASA System Wide Safety Project.
The Aviation Safety Monitor provides quantitative estimates of safety margins at 26 airports in 17 metropolitan regions in the United States. This information complements data on several safety-related events that are published elsewhere, with the FAA’s Runway Incursion Statistics website a good example. However, the available safety information can be misleading if it only reports the frequency of violations with no insight into how safety buffers may vary minute-to-minute and day-to-day. The Aviation Safety Monitor aims to provide this insight every week.
