Insight for an Uncertain World

About the Aviation Safety Monitor
The Aviation Safety Monitor is a service provided by Robust Analytics to deliver timely information on terminal area safety in the National Airspace System (NAS). The safety monitoring and prediction technologies were developed by Robust Analytics over the past several years. Partial funding was provided by the NASA Small Business Innovation Research Program and the NASA System Wide Safety Project.
The Aviation Safety Monitor provides quantitative estimates of safety margins at 26 airports in 17 metropolitan regions in the United States. This information complements data on several safety-related events that are published elsewhere, with the FAA’s Runway Incursion Statistics website a good example. However, the available safety information can be misleading if it only reports the frequency of violations with no insight into how safety buffers may vary minute-to-minute and day-to-day. The Aviation Safety Monitor aims to provide this insight every week.
How Do We Measure Safety Margins?
The Aviation Safety Monitor summarizes output from Risk Tracker, the Robust Analytics in-time terminal airspace hazard and safety metrics monitoring system.
Aviation Safety Monitor Weekly Report for the Week Ending August 2, 2025
Last week saw a small improvement in terminal airspace safety margins, an encouraging change after the previous week’s disappointing metrics. Total buffer encroachment durations in all separation conformance categories decreased 5.8 percent, driven by a 12.5 percent fall in category A and B encroachment durations. The number of buffer encroachment events also fell after increasing for three consecutive weeks. The encroachment duration per event rose slightly from 18.6 to 19.3 seconds, but the metric remains near its low for past year. The 7-day moving average of hourly encroachment durations also fell, reversing the trend for the previous two weeks. Per aircraft exposure metrics are holding steady. Overall, it was a good week for terminal airspace safety margins.
Weekly Safety Margin Update. Every Monday Robust Analytics reports on safety margins at 26 United States airports. With this Aviation Safety Monitor Weekly Report, Robust Analytics offers the aviation community timely assessments of changing safety margins and safety-related events. Dates and times are tracked in UTC and the week ends at midnight every Saturday. This week’s report includes data through 2400 UTC on August 2, 2025.
For New Readers: Please read our article “Did Safety Degrade in the National Airspace System in the Winter of 2022-2023?” that applies our methods and data to examine whether safety margins decreased during the events of winter 2022-2023. https://www.linkedin.com/pulse/did-safety-degrade-national-airspace-system-winter-kpq8e/?trackingId=dLIUDpIMzA34g3H4GDwrHw%3D%3D
The Aviation Safety Monitor measures safety margins by estimating the frequency, duration, and severity of buffer encroachments. Our paper “How Do We Measure Safety Margins?” provides a detailed description of the methods and data. That article can be found here https://www.robust-analytics.com/measure on the Robust Analytics website.
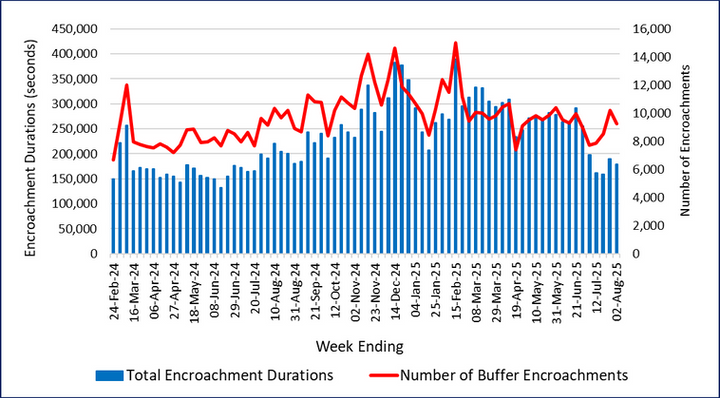
The Weekly Safety Report uses buffer encroachment events and durations to measure changes in safety margins. Safety margins made significant improvements for four weeks until slipping the past couple of weeks. Total encroachment durations decreased 5.8 percent and the number of encroachment events dropped 9.1 percent. Duration per event rose slightly to 19.3 seconds, about the level of one year ago.
Figure 1. Weekly Buffer Encroachment Metrics at 26 Airports
The Aviation Safety Monitor calculates buffer encroachments in four separation conformance categories based on the severity of separation deviation. Category PE and C buffer encroachments identify relatively weak separation conformance deviations and are strongly affected by meteorological conditions. In fact, by definition, during visual meteorological conditions there are no buffer encroachments. The more severe encroachments in Category A and B provide a better indicator of changing safety margins.
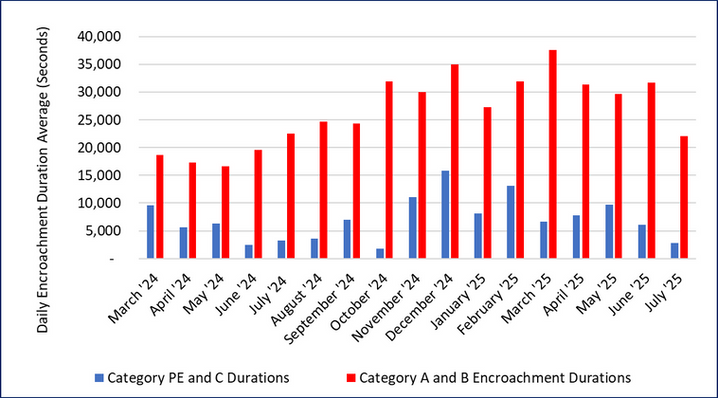
In previous years, Category A and B buffer encroachments would peak in the winter months and they gradually decline. For most of 2025, however, the decline was modest and Category A and B mean daily encroachment durations for April 1 through August 2 were 55 percent higher than the same period one year ago. July was a good month for safety margins, however, as the daily mean encroachment duration fell 34 percent, getting the metric down to a value more typical for midsummer.
Figure 2. Mean Daily Buffer Encroachment Durations By Month
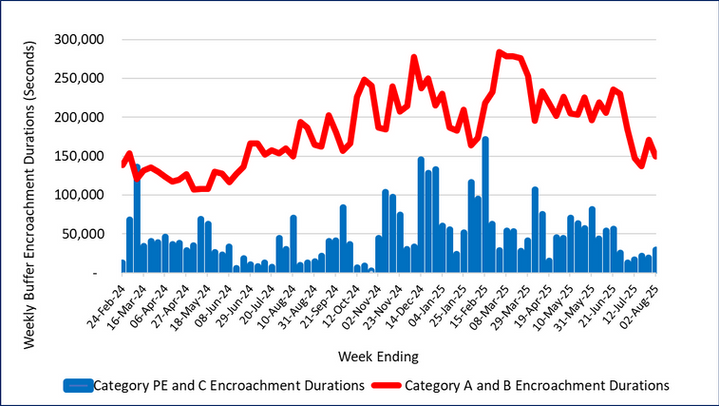
Figure 3 reports the weekly total durations for the two conformance category groupings. The Category PE and C weekly durations bounce around with little long-term trend since we started reporting in February 2024, primarily reflecting week-to-week variations in meteorological conditions and some seasonal variation. Last week the PE and C buffer encroachment durations rose 53 percent from a low level, while category A and B duration totals fell 12.5 percent increased 24.4 percent, for a net decrease of 5.8 percent.
Figure 3. Weekly Trends in Encroachment Durations By Separation Conformance Category
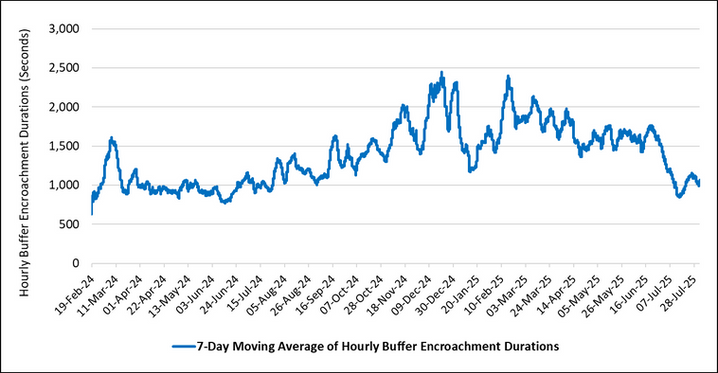
Figure 4 reports the 7-day moving average of hourly buffer encroachment durations in all conformance categories since February 2024. The pattern is very clear, as the historical behavior of increasing buffer encroachments from the summer low into winter held, but metrics did not improve for the first six months of 2025. Buffer encroachment durations rose in September and October, then bumped up again in November and have remained high ever since. Variance improved over the past two months with fewer disturbingly high encroachment periods but the overall level was high until the decline in the past month.
It is only in the past month and a half that we observe a sustained, significant decrease in the buffer encroachment trend since early April 2025. Until the rise the past week and a half, the metric had been at its lowest value since June of 2024. The 7-day moving average of hourly encroachment durations dropped during the past week, after rising steadily over the previous two weeks.
Figure 4. Seven-Day Moving Average of Daily Buffer Encroachment Durations From February 18, 2024 Through August 2, 2025